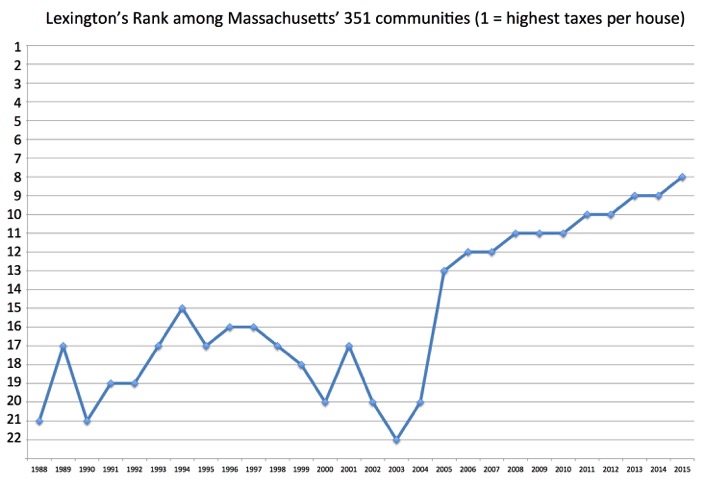
More recently, Lexington’s rank has steadily “risen” making Lexington less and less affordable and less economically diverse. Lexington was 22nd in 2003, but Lexington now has the 8th highest taxes of all Massachusetts communities (source: Mass DOR DLS database), as this line illustrates:
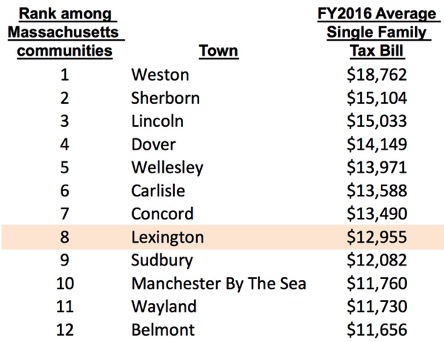
Only Weston, Sherborn, Lincoln, Dover, Wellesley, Carlisle and Concord have higher taxes than Lexington, as follows:
In each town, the tax per average house is the result of 2 major factors:
--• how many “large” houses exist (tear-downs and new additions increase total taxes collected by the town, therefore the tax per average house, but do not change taxes on “unimproved” houses), and
--• how rapidly does the town increase expenses (via operating overrides and debt exclusions, which raise taxes beyond the Prop 2 1/2 limit).
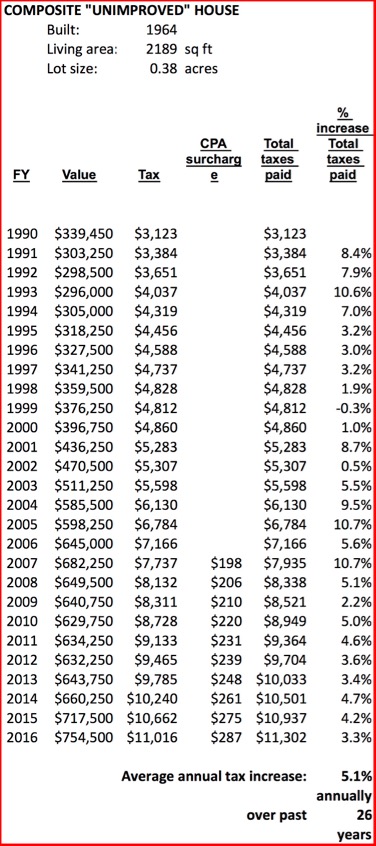
To disentangle these 2 factors, we created a typical “unimproved” Lexington house, a mid-size house that remained the same over a long period of time, without new floors or rooms.
This “unimproved” house experienced a +5.1% tax increase each year since 1990 (including the CPA surcharge instituted in FY2007) (source: Lexington Assessor database and files):
The Town’s tax collections per house lot increase faster than this “unimproved” typical house’s taxes increase because of the other factor — tear-downs and additions to existing houses all across Lexington. Since 1991 Lexington has collected on average +6.1% year-to-year more in taxes per lot (excluding the CPA surcharge), of which
--• +5.0% per year from “unimproved” houses — i.e. from most of us, who did not add to our houses —, and
--• +1.1% per year from new construction (tear-downs and additions to existing houses, called “New Growth”), as follows:

Lexington voters passed operating overrides (permanent tax increases to fund operations of our schools and municipal services) and debt exclusions (to fund borrowings for specific capital projects, beyond the Prop 2 1/2 limits) as follows:
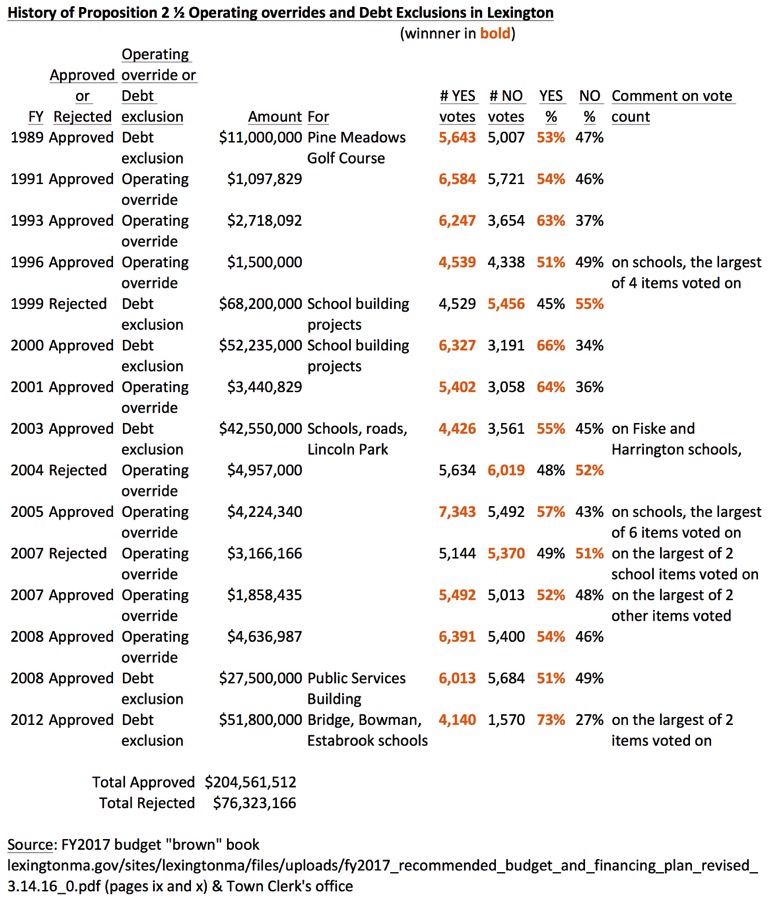
Operating overrides and debt exclusions have over time added another +2.5% in annual tax increase beyond the Prop 2 1/2 limit.
The “unimproved” Lexington house’s annual tax increase since 1990 of +5.1% average year-to-year (including CPA surcharge) was higher after large overrides and debt exclusions passed, as follows:
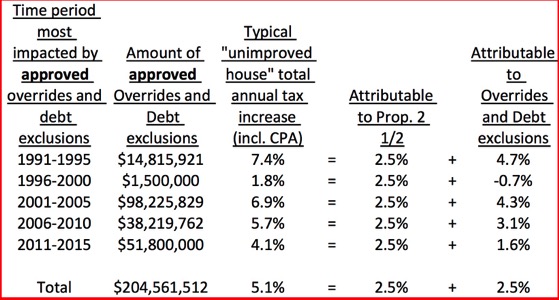
All calculations are in this spreadsheet, in 5 tabs.